AI Monitor, Issues & Ignore Rules
Requires WHP super admin access. These features are unlocked for customers with a WHP super admin role on the server — for example, anyone running a Virtual Dedicated Server. Customers without super admin won’t see these pages.
Site Monitoring is the customer-facing alerting add-on. The admin side exposes three pages — together they let you tune what gets monitored, what surfaces as a customer-visible issue, and what gets suppressed.
Sign in as super admin
Section titled “Sign in as super admin”Super admin access is granted to the root user only. Sign in directly at https://<your-server-hostname>:8443 with the root credentials.
The WHMCS client portal route doesn’t apply for super admin — it signs you in as the linked customer, not as root.
AI Monitor (admin dashboard)
Section titled “AI Monitor (admin dashboard)”Sidebar → AI Monitor → Dashboard. The operational heartbeat of the whole monitoring pipeline.
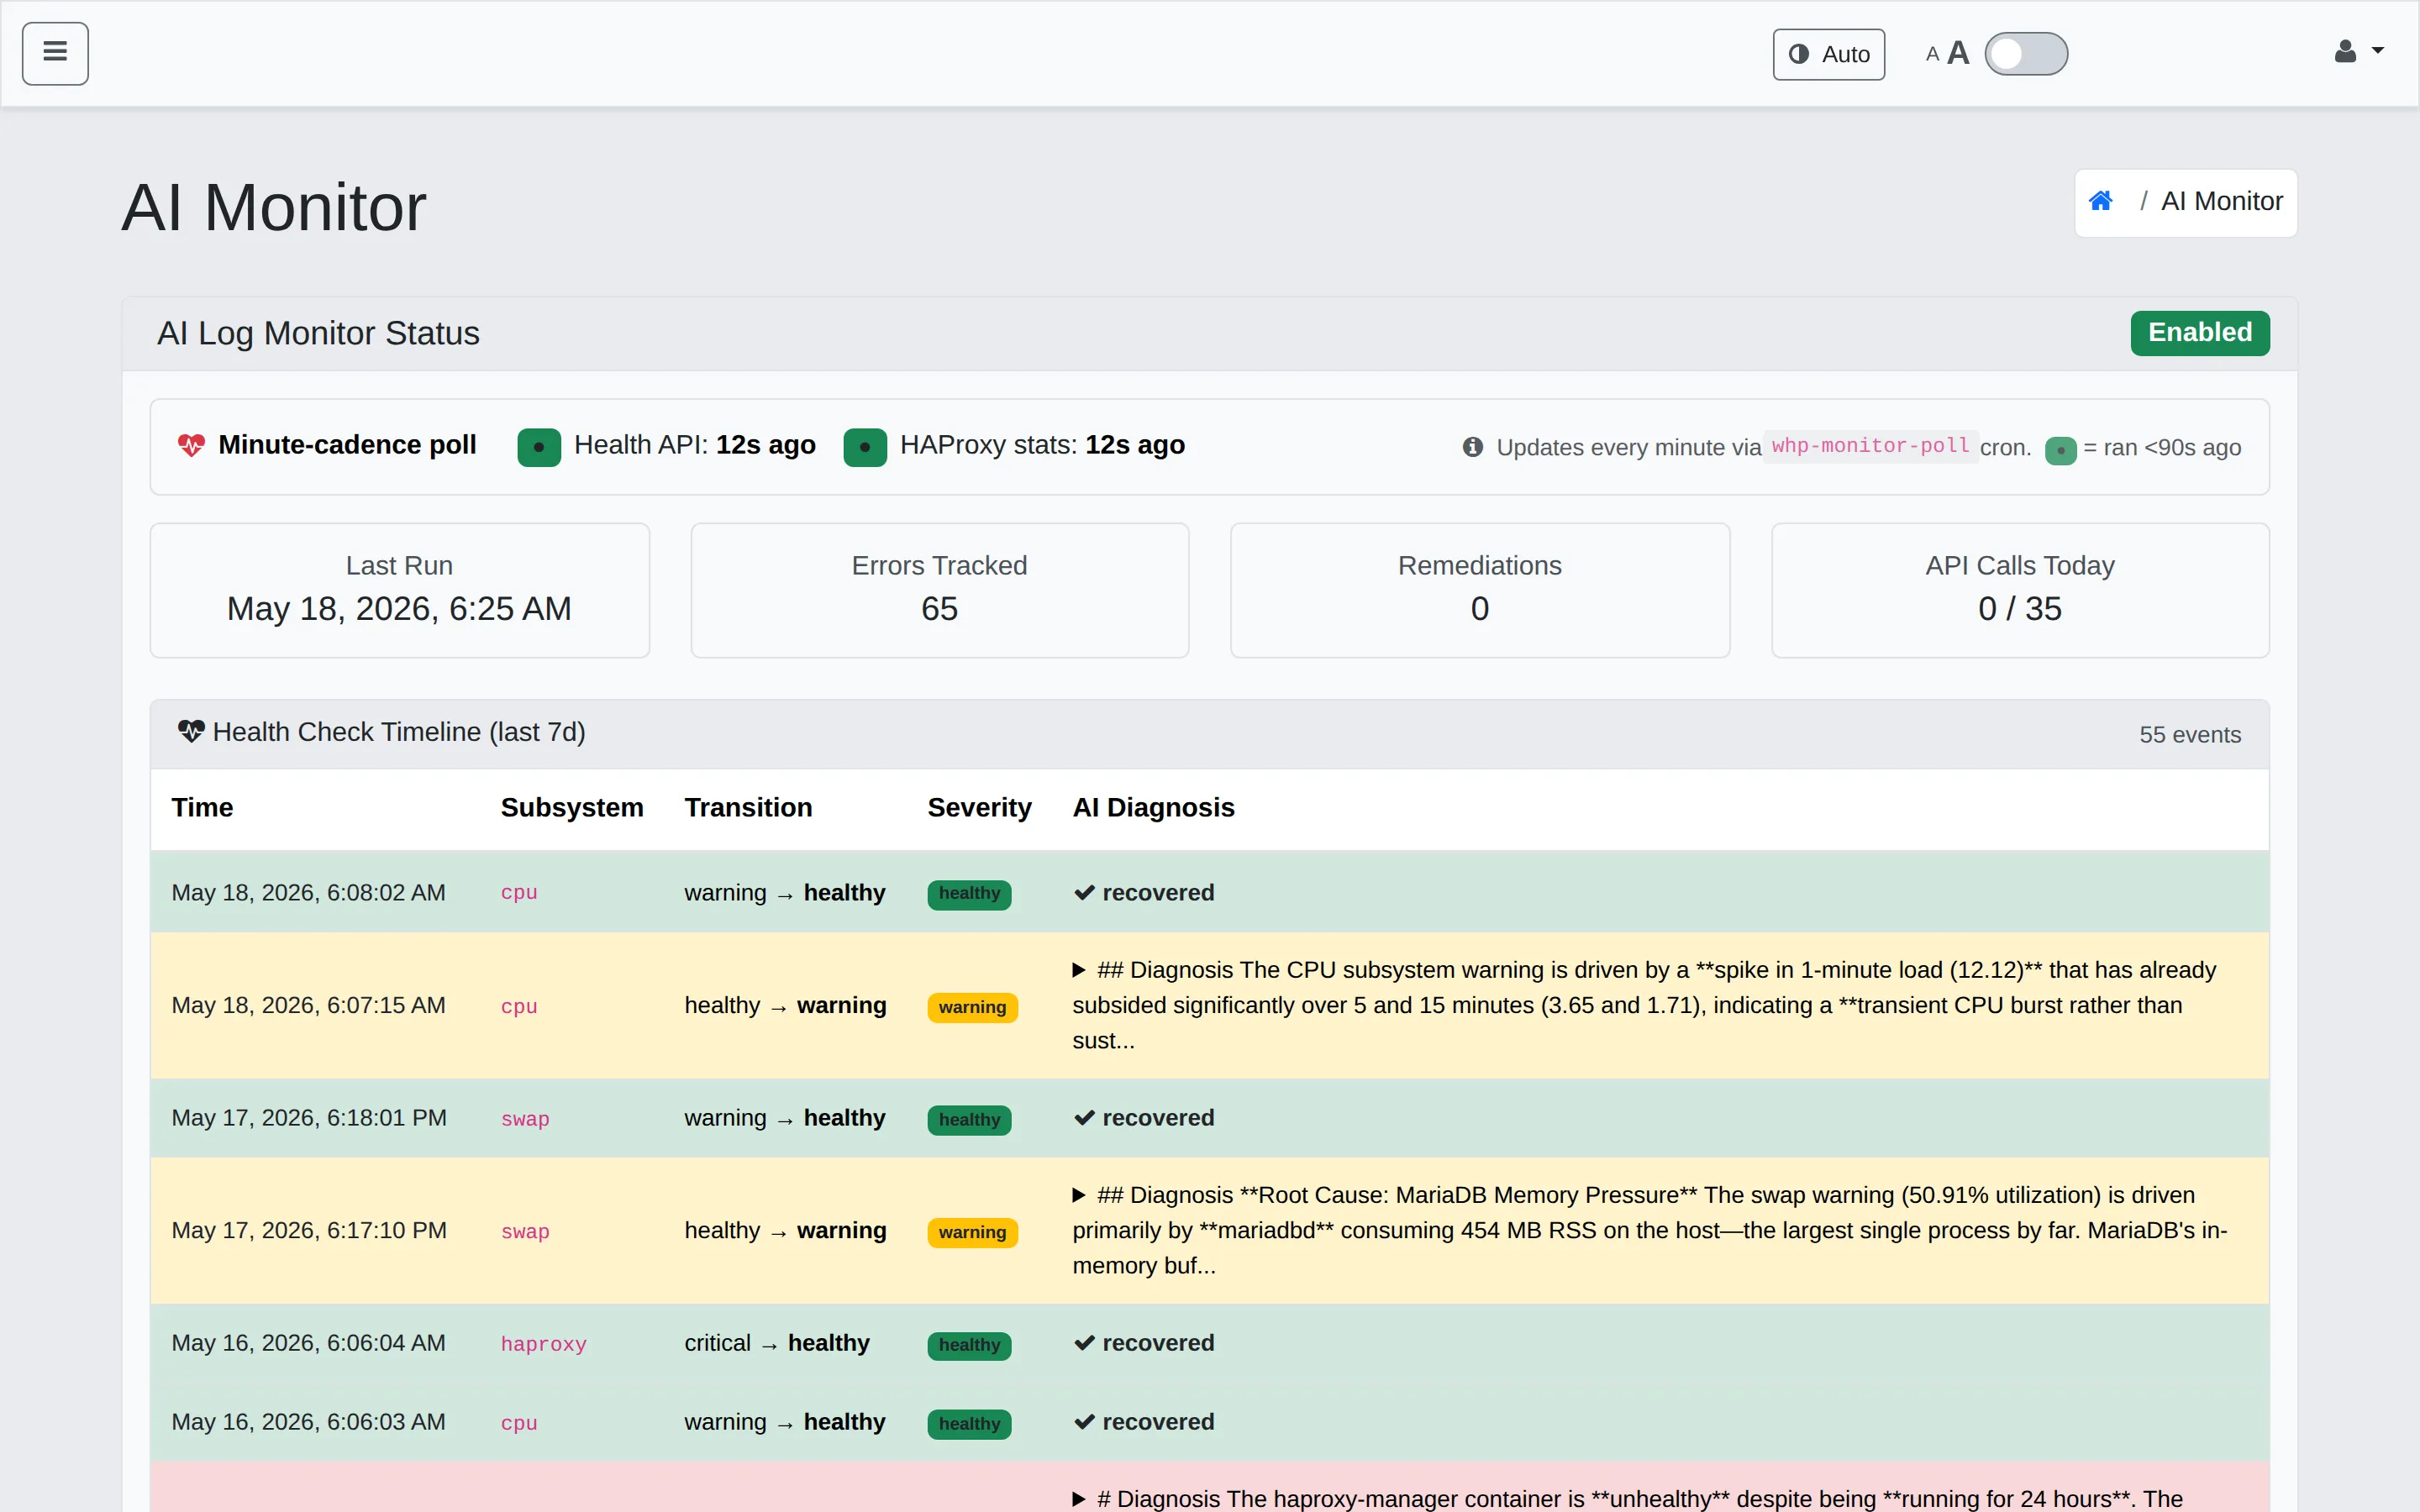
Panels:
- AI Log Monitor Status — overall on/off plus three sub-statuses:
- Minute-cadence poll — the cron that scans logs every minute.
- Health API — the internal API that exposes per-container health.
- HAProxy stats — the proxy stats feed used for error-rate tracking.
- Stat tiles — Last Run, Errors Tracked, Remediations, API Calls Today (with a rate-limit denominator).
- Health Check Timeline (last 7d) — every state transition (
cpu,swap,haproxy, etc.) with its severity and an AI Diagnosis explanation.
Use this page to confirm the pipeline is healthy and to drill into recent state changes. The AI Diagnosis text gives a plain-language summary of why a transition happened — useful for context before you act.
Issues
Section titled “Issues”Sidebar → AI Monitor → Issues. The customer-visible findings, server-wide.
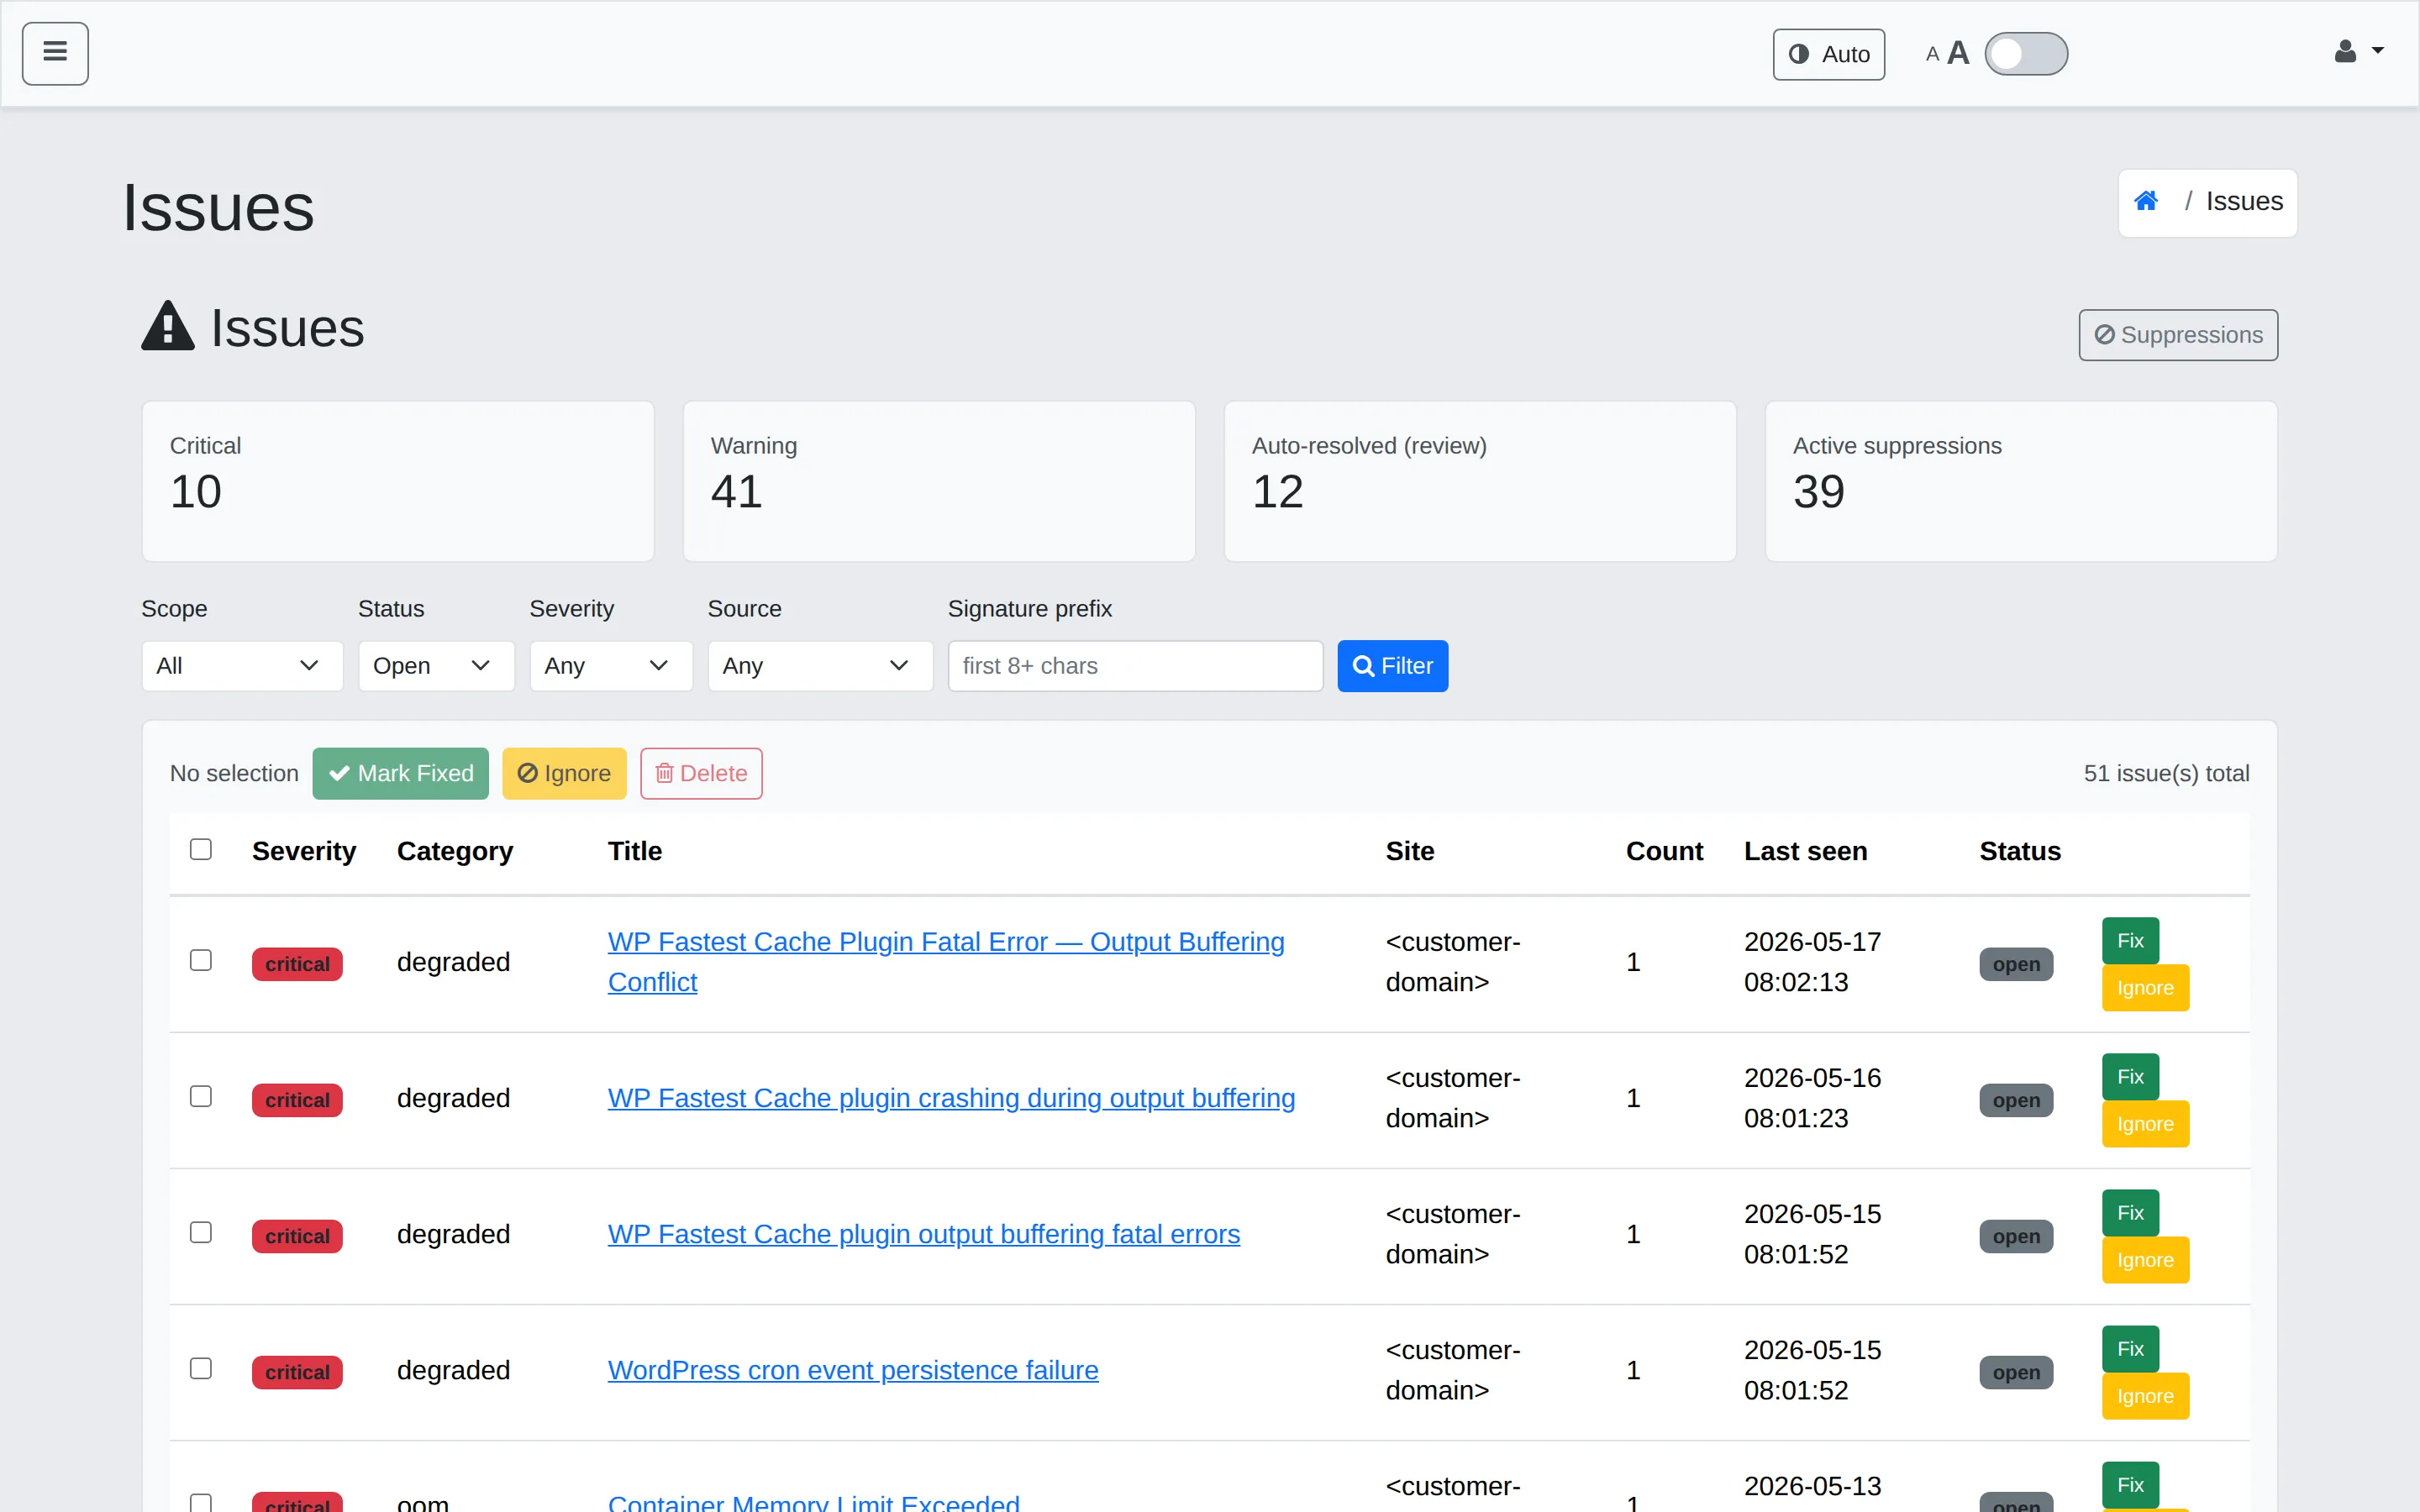
Four stat tiles at the top:
- Critical — open critical-severity issues.
- Warning — open warning-severity issues.
- Auto-resolved (review) — issues the monitor closed on its own that may still need a human glance.
- Active suppressions — issues currently muted by an Ignore Rule.
Filter row: Scope (All / specific user), Status (Open / Closed / All), Severity, Source, Signature prefix.
Bulk actions: Mark Fixed, Ignore, Delete.
Each row has its own quick-actions: Fix (close it) and Ignore (create an ignore rule from this row’s match criteria).
Ignore Rules
Section titled “Ignore Rules”Sidebar → AI Monitor → Ignore Rules. Match criteria that prevent matching findings from becoming customer-visible issues.
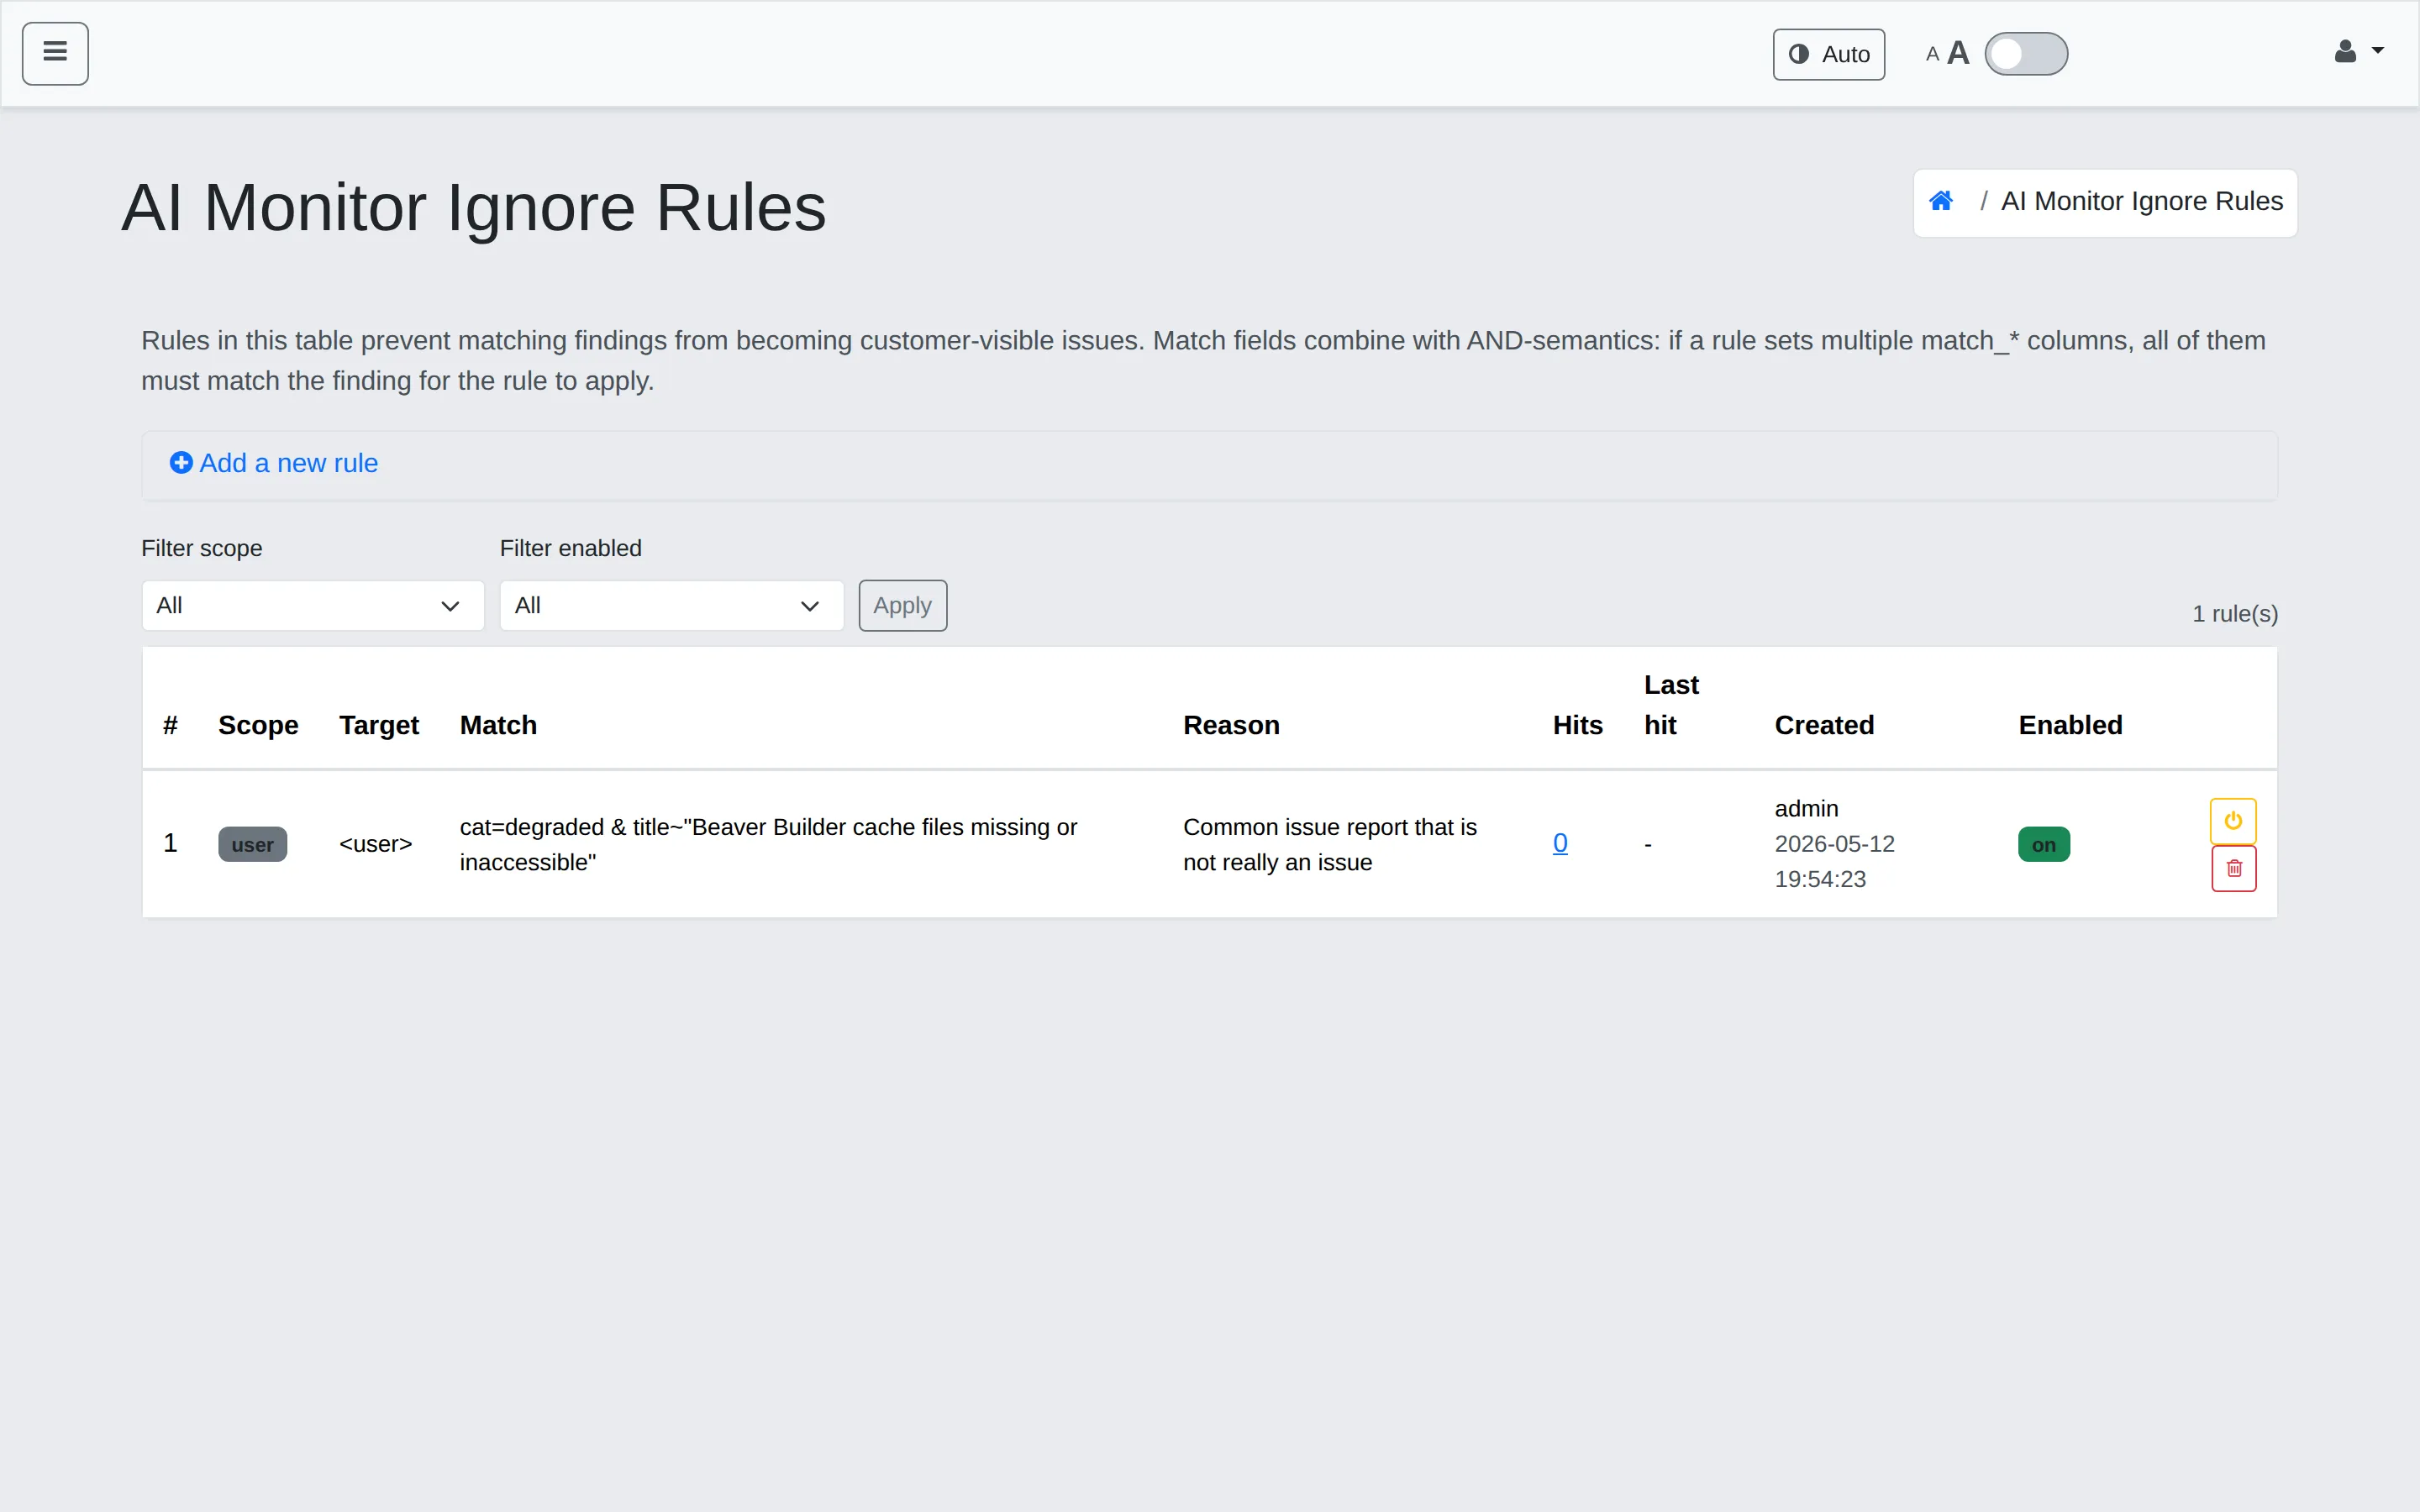
Each rule has these fields:
- Scope —
user(just one customer) orglobal(every customer). - Target — the user or domain the rule applies to.
- Match — a comma-separated set of
field=valuepredicates (e.g.cat=degraded & title~"Beaver Builder cache files missing"). Match fields combine with AND semantics — every predicate must match. - Reason — a short note for future-you explaining why the rule exists.
- Hits / Last hit — how often the rule has matched, and when.
- Enabled — toggle without deleting.
Common tasks
Section titled “Common tasks”Mute a known-noisy finding for one customer
Section titled “Mute a known-noisy finding for one customer”- Open Issues, find the row.
- Click the row’s Ignore action — that pre-fills an Ignore Rule with the matching criteria scoped to that user.
- Add a Reason so future-you (or someone else on the team) understands why it exists.
- Save. Future matching findings will be suppressed; the Active suppressions tile will tick up.
Investigate an “Auto-resolved (review)” issue
Section titled “Investigate an “Auto-resolved (review)” issue”These are issues where the underlying signal recovered before a human looked at them. Open the row to see the AI Diagnosis and the original detection. If the resolution looks legitimate, click Mark Fixed; if you’re suspicious, leave it open and add a comment for context.
Tune brute-force detection
Section titled “Tune brute-force detection”Brute-force rules live in Coraza Rules (rule families CRS-913 / 921 / 942 / 949) rather than AI Monitor. AI Monitor surfaces the effects (error spikes) once a brute-force pattern fires, but the matching itself is in the WAF — see Coraza WAF rules.
Routing alerts
Section titled “Routing alerts”Customer email alerts are sent via the SMTP relay configured on Server Settings → Mail → Outbound Email (SMTP). Toggle Enable Outbound Email off there if you need to silence outbound notifications for a maintenance window.
Troubleshooting
Section titled “Troubleshooting”Pipeline shows “stale” — Last Run more than a few minutes ago. Check the cron’s container on Server Settings → Services → Docker Container Management. The monitor poll is whp-monitor-poll.
Issues appearing for a known noisy site. Add an Ignore Rule scoped to that user.
No customer alerts arriving. Confirm Outbound Email is enabled and the SMTP relay is reachable from the server.
Related
Section titled “Related”- Site Monitoring add-on — the customer-facing side.
- Coraza WAF rules — request-level firewall.
- Server settings & services — SMTP relay config for outbound alerts.
Still stuck?
Section titled “Still stuck?”Still stuck? Open a support ticket and our team will help.